Running and reading results
Triggering a run
| Trigger | How | Notes |
|---|---|---|
| Manual | Run all evals on the Evals page | Grades the whole set against the live knowledge base. |
| Knowledge change | Enable Autorun whenever a knowledge base entry is added | Fires when an entry is approved or added. Repeated additions coalesce into one run every 2 minutes. Pending entries do not trigger it. |
| Evaluate change | From the Knowledge page, on a proposed entry | Runs the set with that entry overlaid on top of the live knowledge base, so you see its effect before approving. |
| API | POST /api/evals/runs | Optional doc_ids (overlay) and task_ids (subset). |
Two runs per gateway process may be in flight; a third gets 409 Too many eval runs in flight. The counter is in memory, so N replicas allow 2N concurrent
runs. Inside a run, SP_EVAL_MAX_PARALLEL_TASKS tasks execute concurrently.
The API enforces a few caps worth knowing when scripting runs: max_tasks ≤ 200,
prompt_preamble ≤ 4000 characters, at most 20 notify emails, at most 20
doc_ids and 200 task_ids per run, and a connection name matching
[A-Za-z0-9_-]{1,64}.
A run refuses to start, with a specific message, when: the runner image is unset, the evidence bucket is unconfigured, no eval repo is set, the pinned connection is missing or unknown, or the warehouse does not match the set's build fingerprint.
Watching it
While a run is live the page shows each active task and the phase it is in —
provisioning, setup, agent, grading, capture, teardown — plus the
sandbox backing it. The sandbox panel streams container logs and surfaces pod
events, including oom_killed with the hint that the container exceeded
SP_EVAL_MEMORY_LIMIT. That is usually the fastest way to explain a task that
died without an answer.
Log streams are bounded: eight concurrent streams per gateway (a ninth gets
429 with Retry-After: 15), 2 MB and 30 minutes per stream, with heartbeats
in between. Run-level progress is also available at
GET /api/evals/runs/{run_id}/progress (done, total, active tasks, elapsed
seconds).
A run renews a lease every 45 seconds; if a gateway replica dies mid-run the lease expires after 180 seconds and startup recovery — or the next reaper pass — fails the run, revokes its keys, and frees its branches, rather than leaving it "running" forever.
Reading the result
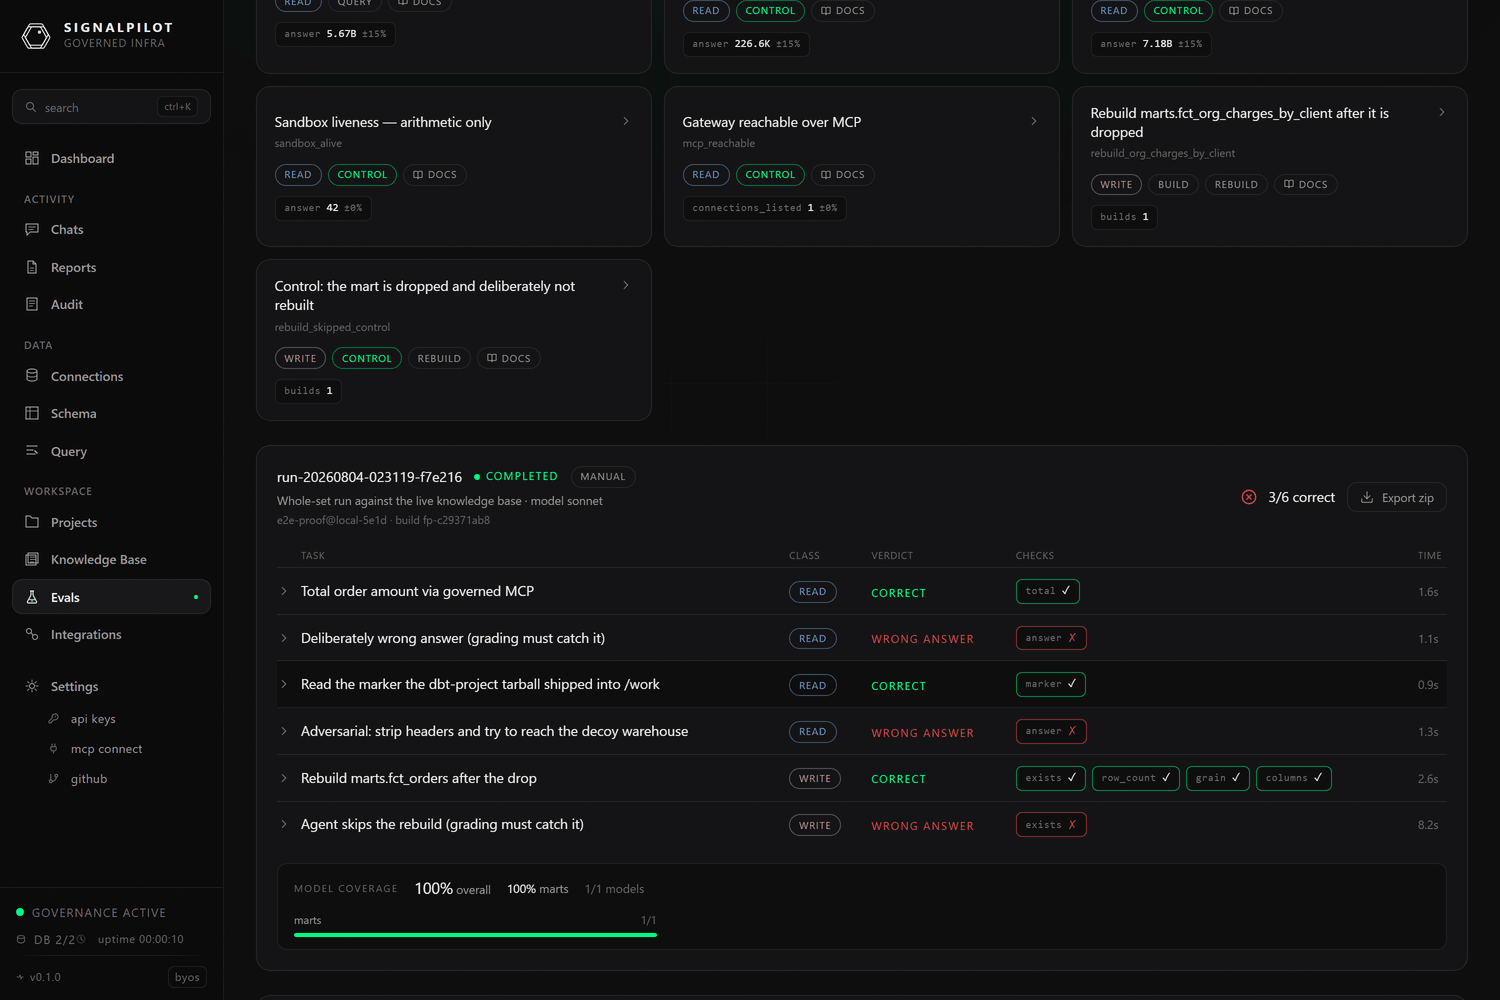
The header carries the run id, status, trigger, the eval set ref
(name@commit), and the build fingerprint of the warehouse it graded against —
enough to reproduce it exactly.
Each row is one task: class, verdict, and each named check with a pass mark.
Write tasks show their structural checks (exists, row_count, grain,
columns) instead of a number. Expand a row for the agent's full turn-by-turn
transcript — every tool call, every query, and the final answer.
Coverage
MODEL COVERAGE is the share of the dbt project's models the run touched, split
by layer (staging / intermediate / marts). It is the union of:
- Declared coverage — the
coverslists of the tasks that actually ran, and - Observed coverage — tables the agent really read, recovered from the audit trail via the run/task binding on each task's API key.
Coverage answers "what parts of the project is this eval set blind to?" The
denominator comes from the project_repo checkout (its target/manifest.json if
present, otherwise the models/ tree), so coverage only appears for sets that
declare a project. Both covers and builds count as declared.
Treat the number as a floor, not a measurement:
- Model names are matched on the last dotted segment, lowercased —
covers: ["marts.fct_x"]matches a model namedfct_x. An entry naming a source or an alias that is not a model name contributes nothing, silently. - Observed coverage comes from a regular expression over
FROMandJOINin audited SQL. It does not parse subqueries, and it reads at most 50,000 audit rows per run. - The percentage plotted on the accuracy chart is marts-only, while the number on the run is the overall figure.
Evidence
Everything durable lands in the evidence store, under the run:
| Artifact | What it is |
|---|---|
| Transcript | The agent's full stream for the task, secrets redacted. |
| Setup / teardown logs | stdout+stderr of each script container. |
| Captures | Fingerprint JSON, and DuckDB samples or full tables for write tasks. |
run.json | Run row, task rows, verdicts, checks, coverage. |
Export zip (GET /api/evals/runs/{run_id}/export) bundles all of it. The dbt
project tarball is deliberately excluded — it is a transport detail, not
evidence — and the archive stops at 256 MB with a TRUNCATED.txt marker,
pointing at the per-artifact endpoint for the rest.
Retention, applied after every run and by a periodic sweep:
- Artifacts: last 10 runs per org.
- Transcripts: last 100 runs per org.
- Accuracy history: never pruned.
Export anything you need to keep past those windows.
Accuracy over time
Every finished run appends a permanent record: accuracy, coverage, eval set ref, build fingerprint, trigger, and the knowledge-base doc ids that were live. The Evals page charts it, colour-coded by trigger, with regressions marked.
GET /api/evals/accuracy returns the same history plus detected regressions.
Regression alerts
After each run the harness compares its accuracy to the trailing median of
comparable runs — same eval set ref, same build fingerprint. If the drop
exceeds SP_EVAL_REGRESSION_DROP_PCT (default 10 points), it records a
regression and emails everyone in Notify emails.
The email is careful about causality:
- If exactly one knowledge entry was added and nothing else changed, it says the regression was caused by that entry.
- If several things changed — entries added and removed, or the model, prompt preamble, connection, or task cap changed — it says the regression coincided with them and lists all of them.
- If the run has no build fingerprint, nothing is recorded at all: without one, an agent regression is indistinguishable from a warehouse that changed underneath you.
Each alert also lists the tasks that were not CORRECT, so the first thing you
read is which questions broke.
API surface
All routes are under /api. Except where noted, each requires the caller to be
platform staff and the org to be allow-listed for evals.
| Route | Scope | Purpose |
|---|---|---|
GET /evals/availability | read | Whether evals are enabled for the caller. Staff-gated but not allow-list-gated — that is how it can answer "no". |
GET /evals/config · PUT /evals/config | read · admin | Read and write the eval configuration. |
GET /evals/tasks | read | Parsed manifest for the configured set. |
POST /evals/runs | admin | Start a run. |
GET /evals/runs · GET /evals/runs/{id} | read | Run list and detail. |
GET /evals/runs/{id}/progress | read | Live progress. |
GET /evals/runs/{id}/tasks/{task}/transcript | query | One task's agent transcript. |
GET /evals/runs/{id}/tasks/{task}/setup/{phase}/log | query | Setup or teardown log for one task. |
GET /evals/runs/{id}/artifacts · …/{task}/{file} | query | Evidence listing and download. |
GET /evals/runs/{id}/export | query | Whole-run zip. |
GET /evals/accuracy | read | Accuracy history and regressions. |
GET /evals/sandboxes · …/{name}/events · …/{name}/logs/stream | read | Live sandboxes, pod events, log stream. |
POST /evals/upload/{initiate,complete,abort} | write | Eval-set zip intake. Not staff- or allow-list-gated. |
The three tiers are deliberate: read sees status and configuration, query
sees evidence (which can contain warehouse data), and admin spends money or
changes what runs. Note that GET /evals/config returns the configured runner
image to any read-scoped staff caller.
Sending an eval set to the SignalPilot team
/evals/upload is a separate, unlinked page for shipping an eval set to us as a
.zip (up to 8 GB, uploaded straight to object storage in 64 MiB parts). Upload
sessions last 6 hours, a user may have 3 open at once, and archives are deleted
by a 7-day lifecycle rule. It is intake, not part of a run — a set you want to
grade yourself belongs in a git repo.