Dashboard, chats, reports and health
Four smaller surfaces that answer "what is happening right now" and "what happened earlier".
Dashboard
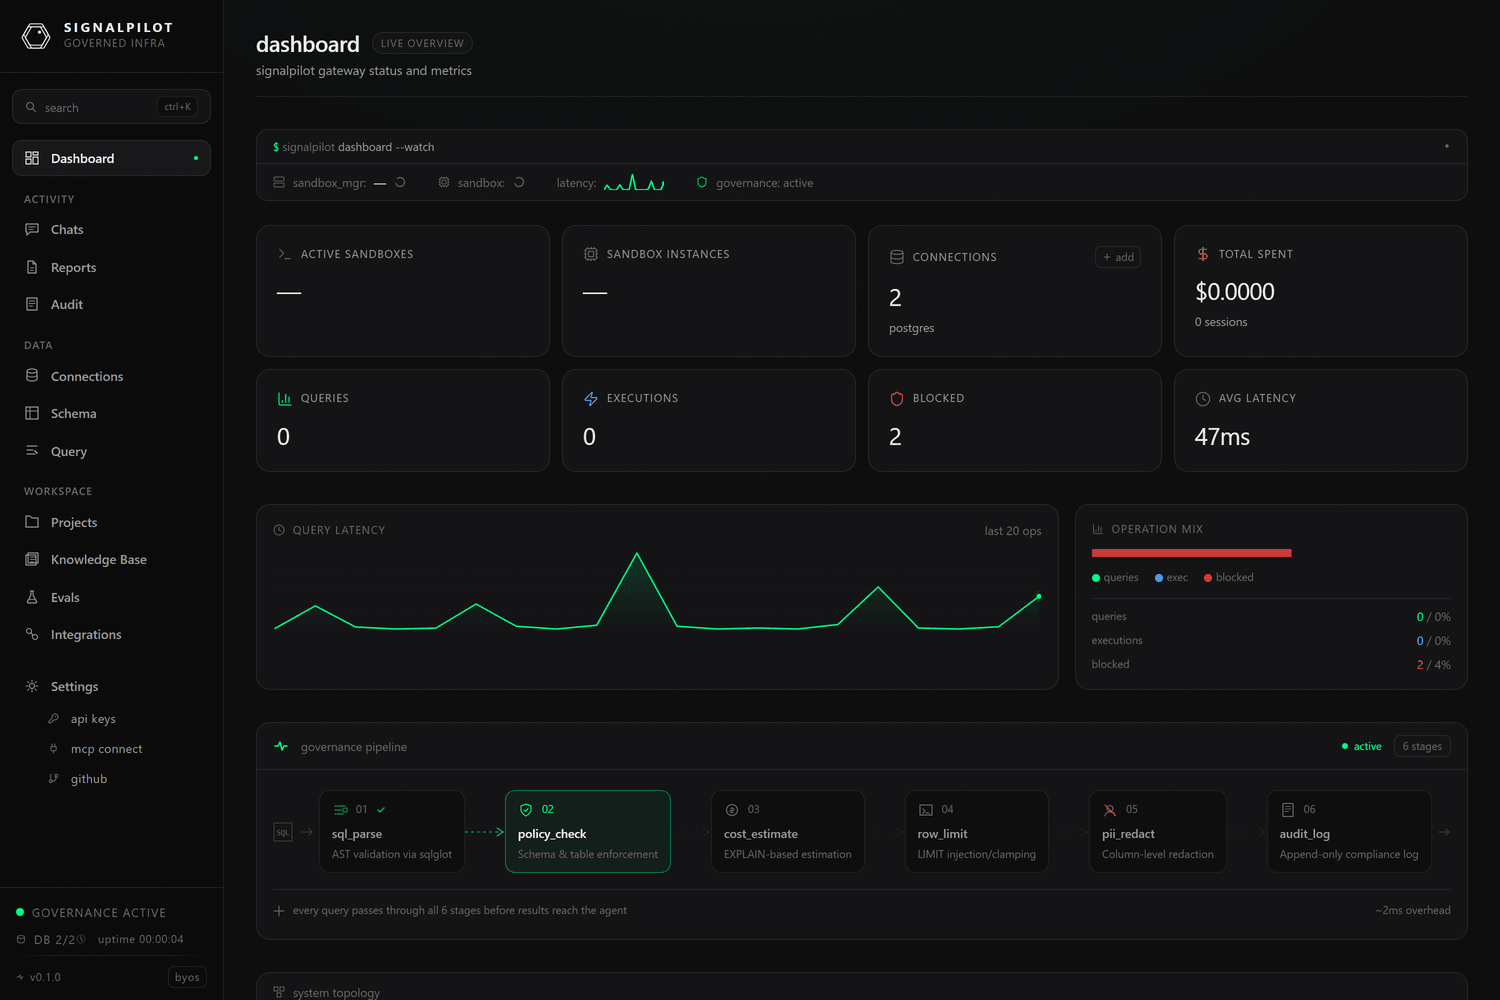
The landing page after sign-in. A live overview of the workspace: connections
configured and their health (healthy / degraded), average query latency,
execution counts, and active sandboxes, with links into each.
Treat it as the daily check: a connection that flipped to degraded, or a
latency figure that doubled, is visible here before anyone files a ticket.
The governance pipeline strip at the bottom is worth a look on day one: it
shows the six stages every query passes through — sql_parse, policy_check,
cost_estimate, row_limit, pii_redact, audit_log — and the overhead they
add.
Chats
Every agent conversation that ran against this workspace, kept as a thread you can reopen. A thread shows the turn-by-turn exchange, the tool calls the agent made, and the per-message cost.
This is the record for "why did the agent do that?" — the tool calls are listed
in order, so you can see which tables it read and which knowledge entries it
retrieved before answering. Threads that are still running show a live
thinking state.
Reports
Rendered HTML reports produced by agents through the manage_report tool, with
search across them. A report is a durable artifact — it survives the session that
made it — which makes it the right destination for a recurring analysis.
Reports are capped at 5 MB of HTML each. Agents can also publish to Notion instead; see Notion.
Connection health
Per-connection latency percentiles (p50 / p95 / p99), error rates, failure counts, and cache statistics, refreshed by a background monitor that opens a real connection to every connection in every workspace every 30 seconds.
Status is one of healthy, degraded, or error. Test runs an immediate
check against one connection rather than waiting for the next sweep.
Health events are retained for 7 days. The agent-side equivalent is the
connection_health MCP tool, which returns the same figures.
Sandboxes
The gVisor-isolated Python execution environments — one row per sandbox with its
state (starting, running, stopped), and a detail view per sandbox.
Sandboxes are what notebook and eval workloads execute inside. On the eval side
the same panel streams container logs and surfaces oom_killed and scheduling
events; see Running evals.